Mahsulot tavsifi
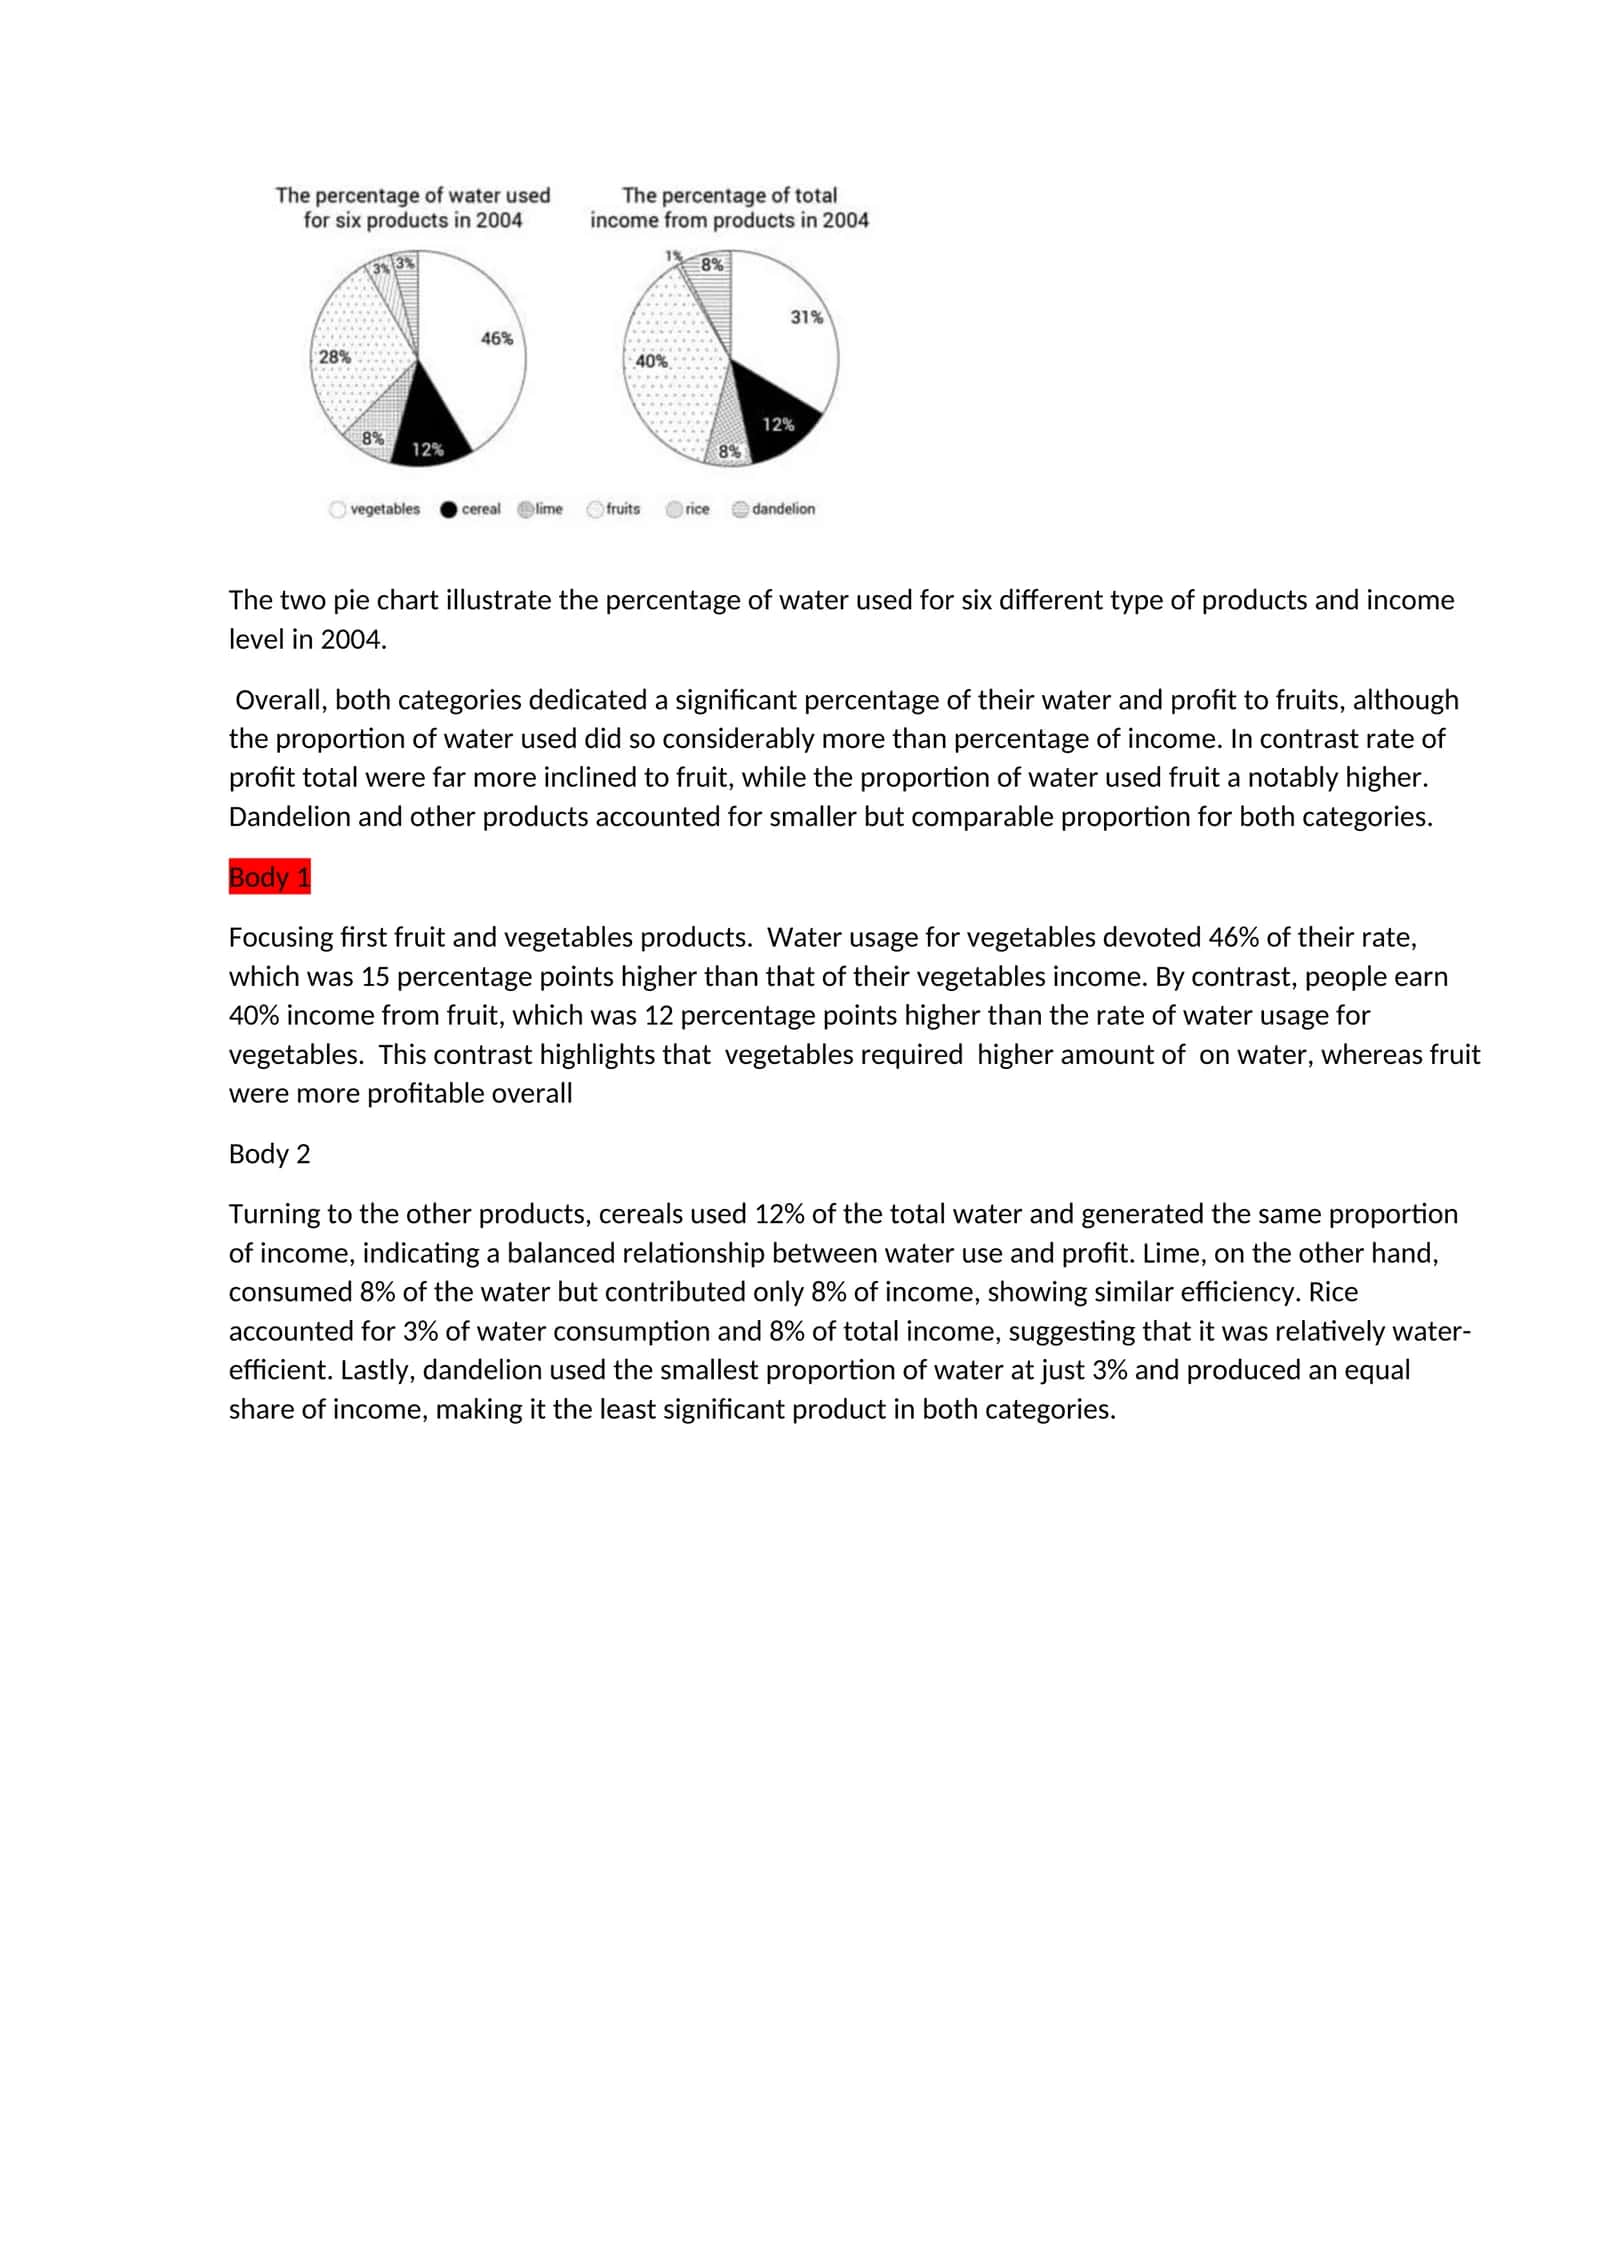
Pie charts are circular statistical graphics used to represent data proportions. Each slice represents a category's contribution to the whole, with the angle showing its percentage. Ideal for comparing parts of a whole, they are most effective with 5-6 categories
#data#pie charts#circular graphics#visual data#percentage
Muallif

Oson TalabaTasdiqlangan muallif
- Hujjatlari
- 43 458
- Sotilgan
- 1 846